Section 1.2 How to Make Any Graph Spin in Desmos
January 9th, 2022
Today, we're gonna mess around in Desmos. That's right, I'll show you how to make any Desmos graph rotate around any location on the plane you want! Fair warning, what's about to unfold is a bit ridiculous.
The approach we'll take has three main steps, as follows:
Parameterize the curve into two functions, \(x(t)\) and \(y(t)\text{.}\)
Apply the rotation matrix, \(\begin{bmatrix} cos(\theta) & -sin(\theta) \\ sin(\theta) & \text{ }cos(\theta) \end{bmatrix}\) to the column vector \(\begin{bmatrix} x(t) \\ y(t) \end{bmatrix}\text{.}\)
Create a slider for \(\theta\) and let the value of \(\theta\) vary over time.
The first step is usually the hardest.
Subsection 1.2.1 Erster Ablauf: Parameterize the Graph
To be completely transparent with you, this post is going to be very hand-wavy. I'll show you exactly what you need to do to get your graph rotating, with little further explanation. I really recommend you look deeper into the topics we're going to look at, though. There's a lot of cool stuff here!
So, let's get started by parameterizing our curve. It'll be good to work with an example, so throughout this post, I'll be making the implicitly-defined curve \(y^3 + 3xy = 2\) spin.
The process follows these steps:
Solve either for \(x\) in terms of \(y\text{,}\) or for \(y\) in terms of \(x\text{.}\)
If you solved for \(x\) in terms of \(y\text{,}\) let \(x_{c}(t)\) equal your expression for \(x\) in terms of \(t\text{,}\) and let \(y_{c}(t) = t\text{.}\)
If you solved for \(y\) in terms of \(x\text{,}\) let \(x_{c}(t) = t\text{,}\) and let \(y_{c}(t)\) equal your expression for \(y\) in terms of \(t\text{.}\)
On the other hand, if your curve is already parameterized, then you can skip this whole first section. Convenient!
Now, for the curve \(y^3 + 3xy = 2\text{,}\) it'll be easier to solve for \(x\) in terms of \(y\text{,}\) so let's do that:
Then we let \(x_{c}(t) = \frac{2 - t^3}{3t}\) and \(y_{c}(t) = t\text{.}\) That's it, our curve is now parameterized! Let's go look at the fruits of our labour in Desmos.
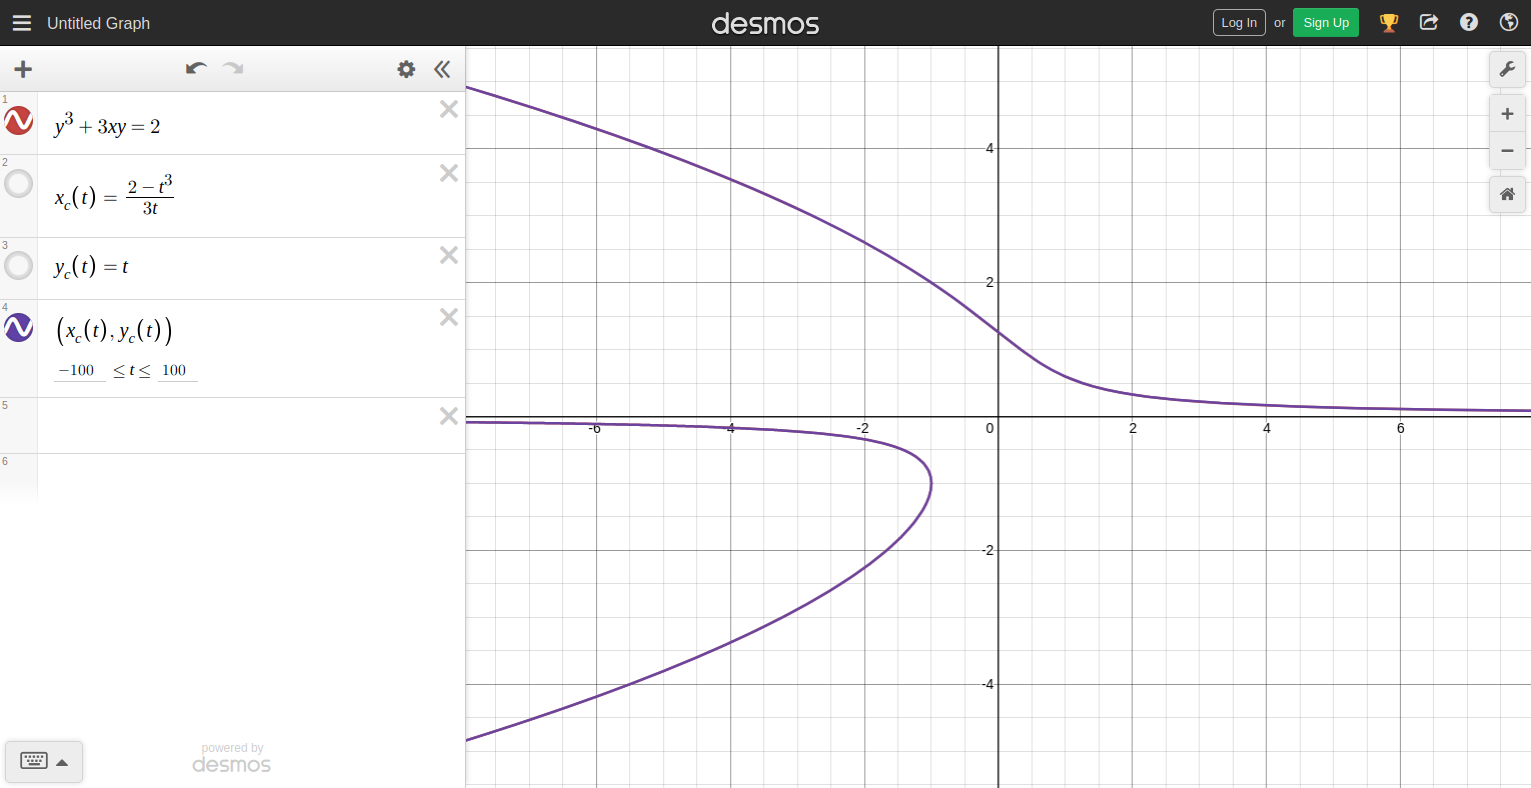
Type what you see in the image above into a new Desmos graph. If the picture is blurry, try zooming in on your browser or opening the image in a new tab. You should get two identical curves, right on top of each other. It's important to set a large range for the parameterization variable \(t\) in order to draw the curve.
Try messing around with that inequality for \(t\) and see what happens.
With some overly complex curves, simply solving for one variable in terms of the other is not going to work. In that case, you'll have to apply more complicated parameterization techniques — check online! You could also just break the curve up into parts, and spin each part separately.
Subsection 1.2.2 Zweiter Ablauf: Apply the Transformation Matrix
What the line \((x_{c}(t), y_{c}(t))\) does in Desmos is graph all the points \((x, y)\) on the plane which satisfy the equations \(x = x_{c}(t)\) and \(y = y_{c}(t)\) as \(t\) varies between its lower and upper bound. Unsurprisingly, that traces out the curve in question.
So now, let's add in the rotation! Doing so is going to require us to venture to the land of linear algebra, as we're going to utilize some matrices. You don't need to know any linear algebra to follow the process, though some of the explanations may fly over your head. That's no problem.
We can express any point \((x, y)\) in the x-y plane as a 2 by 1 column vector, \(\begin{bmatrix} x \\ y \end{bmatrix}\text{.}\)
If we then wish to rotate the point \((x, y)\) around the origin by an angle \(a\) to obtain the rotated point \((x_{r}, y_{r})\text{,}\) we need to multiply the column vector with the 2D rotation matrix on the left, like so:
In our case, we're going to multiply using the column vector \(\begin{bmatrix} x_{c}(t) \\ y_{c}(t) \end{bmatrix}\text{,}\) which represents our curve. A bit of matrix multiplication gives the following:
If we now compare components, we see that \(x_{cr}(t) = x_{c}(t)\cos(a) - y_{c}(t)\sin(a)\) and \(y_{cr}(t) = x_{c}(t)\sin(a) + y_{c}(t)\cos(a)\text{.}\)
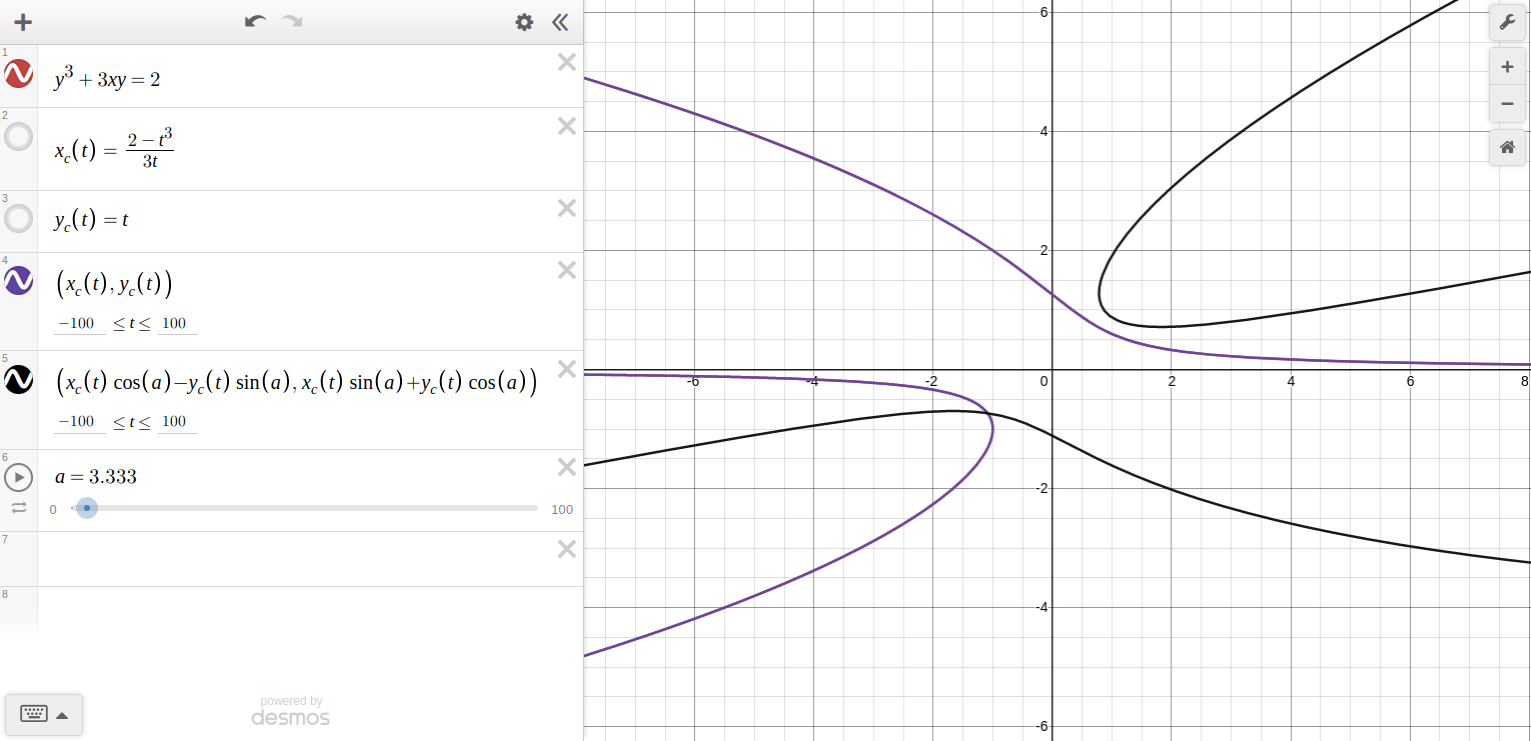
Add these new lines of math to your Desmos graph. You should see a copy of the curve, and if you press play on \(a\text{,}\) the graph should start rotating! What a success, right? By the way, my graph is in radians.
As \(a\) increases, the graph rotates counterclockwise. As \(a\) decreases, the graph rotates clockwise.
Subsection 1.2.3 Dritter Ablauf: Rotate Around a Specified Point
Perhaps you require the curve to rotate around a certain point. No problem, this can also be done! Given a point of rotation \((x_0, y_0)\text{,}\) we execute another step-oriented process:
Translate the graph of \((x_{c}(t), y_{c}(t))\) by \(-x_0\) units on the \(x\)-axis and by \(-y_0\) units on the \(y\)-axis.
Apply the transformation matrix to the translated column vector.
Translate the resulting graph of \((x_{cr}(t), y_{cr}(t))\) by \(x_0\) units on the \(x\)-axis and by \(y_0\) units on the \(y\)-axis.
What this process does is it moves the point of rotation from \((x_0, y_0)\) to the origin, applies the rotation matrix, then moves the point of rotation from the origin back to \((x_0, y_0)\text{.}\)
These steps must be undertaken in this order, as the rotation matrix only rotates around the origin. This is what's going on, mathematically:
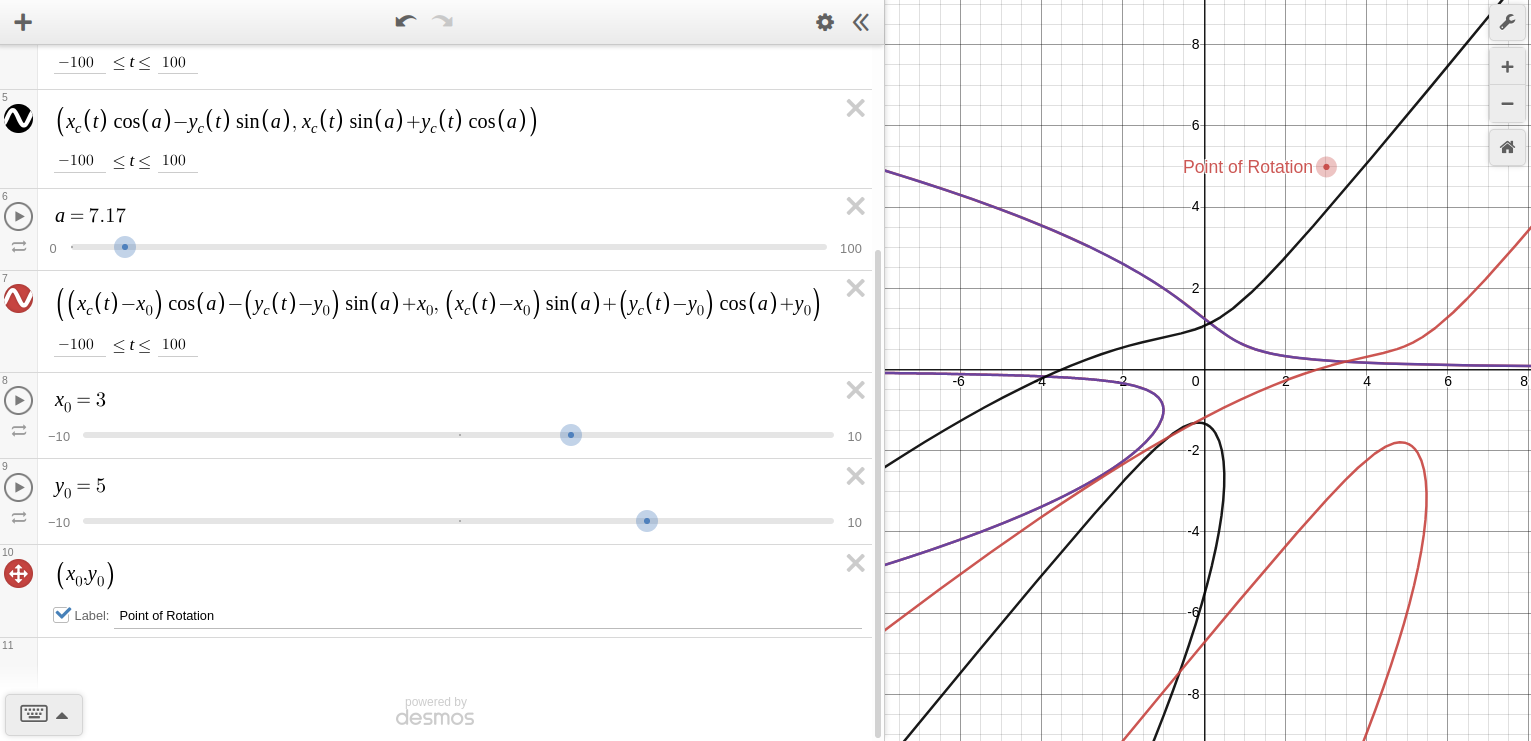
Add what you see in the image to your Desmos graph. The red graph rotates around the Point of Rotation! You can, of course, change the values of \(x_0\) and \(y_0\) to your heart's content, as well as the rate of rotation, etc.
I've created an example Desmos project for you to fiddle around with. Click here.
There are, of course, other methods to rotate a curve in Desmos, and I hope you find this approach relatively simple. Now, go forth and make your graphs spin!